
Publications

Banking Crisis and Its Impact On Market Liquidity
In this paper, we examine bank failures' impact on market liquidity. We also introduce a systematic approach to quantify and measure liquidity shock induced by the failure of a liquidity provider. The magnitude of recent bank failures sparked financial contagion fear. Total assets of Silicon Valley Bank and Signature Bank was US$319 billion or 85% of the total assets of the failed banks during the Global Financial Crisis of 2008.
Please email contact@bestx.co.uk if you are a BestX client and would like to receive a copy of the paper, which is also hosted within our FAQ section of the UI.

Equity Venue Analysis
Our latest research is focused towards Venue analysis in the Equity TCA space. The paper aims to explore the various venue statistics which aims to help the user to measure, identify and choose venues most closely aligned with their execution strategies.
Please email contact@bestx.co.uk if you are a BestX client and would like to receive a copy of the paper.

Update on the BestX Event Risk Model
Our latest research article provides an update from the BestX event risk model that we introduced in August this year. Recent moves in the VIX, and the forthcoming US election, have resulted in the model triggering. This means that the probability of further shocks has increased, and any additional spikes leading up to the election would cause the model to start predicting an impact on transaction costs. We will continue to monitor closely.
Please email contact@bestx.co.uk if you are a BestX client and would like to receive a copy of the paper.

BestX NFP Sentiment Index
In our latest research article we turn our attention to the deployment of big data in order to try to predict NFP. As an alternative approach to the traditional econometric models, we have researched the use of a simple linear model, but one that is based on the incredibly rich data set that is now available via Google Analytics. Testing indicates that the model produces improved predictions versus the market consensus. Such a prediction could obviously add value in helping trade timing when executing on NFP days, and also provide an additional sentiment indicator for more generic risk management applications.
Please email contact@bestx.co.uk if you are a BestX client and would like to receive a copy of the paper.

The Impact of Extreme Events
In our latest research article we analyse the impact of volatility shocks in the financial markets. We move away from traditional methods to analysing volatility and use a technique originally deployed to model the impact of earthquakes and subsequent aftershocks.
Exploring equity, fixed income and FX markets provides interesting insights into how long shocks typically persist in each asset class, and what the probabilities are of subsequent shocks. For example, in equity markets we find that following a volatility shock there is a significant probability of a further shock over the ensuing 8 days. In fixed income, this lasting impact period is much longer, lingering for 45 days on average, but with a lower probability of subsequent shocks. The research has a number of potential applications, for example, as risk management signals, or potentially as predictors of changing liquidity conditions.
Please email contact@bestx.co.uk if you are a BestX client and would like to receive a copy of the paper.

Measuring execution performance across asset classes
It doesn't matter how beautiful your theory is, it doesn't matter how smart you are. If it doesn't agree with experiment, it's wrong.
Richard P. Feynman
Transaction cost analysis means many different things to many different people, depending on the role or seniority of the user and whether the user specialises in a particular asset class or has cross-asset class responsibilities. This article explores some of these key differences in the context of the challenges that they raise when measuring costs and designing an execution analytics platform for such a diverse set of users. We’ll discuss post-trade analysis for now, given that is where the demand is currently focused and already raises enough complexities, and leave pre-trade for a later date. This subject matter is particularly pertinent to us at the moment as we plough ahead with the build of BestX Equities.
Cost definition
One key area that causes significant confusion across the industry is simply defining what transaction cost actually is. Depending on a user’s background and asset class interest or experience, ‘cost’ can be computed in a multitude of ways. Some examples are provided below:
1. Equities – costs within this asset class are often defined as slippage to a VWAP over a defined period, or Arrival Price, measured at the time the order arrives in the market.
2. FX – VWAP is impossible to compute accurately, so many individuals define cost as slippage to a mid price observed at either market arrival time or completion time.
3. Fixed Income – Far Touch, defined as slippage to the observed bid or offer at the completion time, is often referred to as the transaction cost
Compounding the complexities of the different definitions that different segments of the market have grown up with is the issue of inconsistencies in available data to measure costs, both time stamps and market data. For example, the early adoption of electronic trading in equities and the rise of an order-driven market structure resulted in widespread availability of accurate and multiple time stamps for a given order. Hence, the focus on Arrival Price as a cost definition within the equity asset class as market arrival time stamps are widely available and have been for decades. In OTC markets such as FX and Fixed Income, such time stamp data is often not available. Of course, transactions executed electronically tend to have some form of market arrival time stamp recorded, although there is not an industry wide definition of exactly what this time stamp represents. For example, for an FX trade executed electronically via an RFQ protocol, different platforms may measure the market arrival time as the time the buy-side trader submits the order whereas some may measure the time that the broker ‘picks up’ the order, or when they actually provide a quote. Fixed Income represents an even murkier picture than FX, with a large proportion of transactions outside of liquid sovereigns, dealt over the phone, resulting in even greater challenges in recording time stamps. Thus, equities and the majority of spot FX aside, the concept of measuring to an accurate and consistent market arrival time stamp is still a pipe dream.
However, there is a need to measure ‘cost’ consistently across a multi-asset class portfolio, and not just for regulatory cost and charges disclosures or obligations. Heads of Trading wish to see the total cost across their desks and traders, CIOs and best execution committees require regular reporting of total execution costs of the business etc.
Solution – BestX Factors
At BestX we have taken the following approach to provide a solution to this problem. The diagram below in Figure 1 summarises the issue, whereby each asset class has its own specific benchmarks and metrics they focus on, but where possible, there are a subset of common metrics, that are measured on a consistent basis and therefore can be aggregated accordingly.

Figure 1: Cost/benchmark metrics across asset classes
In the design phase of BestX we focused on the need to allow users to select the execution factors they wish to measure, which are relevant to their business and the way they execute. This was also a requirement to ensure the product was deemed compliant for MiFID II. These BestX Factors, an example of which is shown in Figure 2, form a core part of the platform, and provide the ability to view multiple, alternative views of ‘cost’ in the broadest sense.

Figure 2: Example BestX Factors
The two BestX Factors relevant to this particular discussion are:
1. Spread
2. Price
We have defined ‘Spread’ as our core cost metric, which is measured to an independent mid-price observed in the market at the completion time of the trade. This metric sits at the centre of the Venn diagram above, and allows a user with cross-asset class responsibilities to aggregate a measure of cost. Why did we choose completion time? For the reasons described above, generally the one common time stamp that we are provided across all asset classes is the completion time (although even this may be subject to gaps and errors, especially from, for example, sub-custodians). We do provide clients with the option of having everything measured at an arrival time stamp, if this is available for all of their trades across all asset classes, although in our experience this is a minority at this stage.
The inconsistency of time stamp availability also creates issues for other metrics, such as Implementation Shortfall. The ‘classic’ view is to measure slippage with reference to the earliest time stamp, which is typically ‘order origination time’, i.e. when the portfolio manager first raises the order. This is typically only available from the Order Management System (OMS) of the client, as it is not passed through to the Execution Management System (EMS) or executing broker. However, it is rare for an OMS to have all the details of individual fills, e.g. which venue an order was filled on, passed back to it and stored. This raises additional complications in that data needs to be stitched together from multiple sources if the user is to get a complete picture.
Another option is to measure with reference to an arrival time stamp, but as already discussed, this is not always available. Indeed, for one institution, they may have such origination or arrival time stamps available for some trades but not others. When wrestling with this issue for FX when building BestX in early 2016, we took the decision to effectively ‘reverse’ the shortfall measure, and go back in time measuring slippage to the completion time, which was the only point we knew clients could provide us. This at least allowed us to calculate measures that could cope with missing or incomplete trade lifecycles. Not ideal but a purely pragmatic decision to cope with gappy data and as these gaps fill in over time we will revisit this definition.
It is also essential that the common cost metric is computed in a way that can be aggregated across asset classes, for example, always convert into basis points which is a common unit (rather than pips or price cents etc). This issue is particularly complicated in Fixed Income where users may wish to see costs computed in a variety of ways e.g.
i) Computed on price, but measured in cents,
ii) Computed on price, but measured in basis points,
iii) Computed on yield, as a number of fixed income sectors trade on yield rather than price.
We then use the ‘Price’ factor as a way of accommodating all of the other cost measures that specific asset classes require e.g. VWAP in equities. Clearly, such metrics cannot necessarily be aggregated across every trade, so these metrics tend to fall in the other segments of the Venn diagram in Figure 1. In some cases, there may be commonality for some benchmark measures e.g. a client may have market arrival time stamps for their equity and FX trades, but not their fixed income trades. It is therefore also key that the factors can be configured by asset class to allow such aggregation of a subset of trades.
In this way the user should be able to ‘have their cake and eat it’ in terms of common aggregation and also asset class specific cost metrics. Why is this so important? The diverse array of users of TCA software at an institution necessitates such flexibility e.g.:
- A bond trader will want to see Fixed Income specific measures, such as cost computed on a yield basis, or slippage to Far Touch on an individual trade level, whereas the Global Head of Trading at such an institution may want to see aggregate summary reports of costs across all asset classes, whilst retaining the ability to drill into the Fixed Income specific view if required.
- Users within oversight functions such as Risk and Compliance will typically wish to see metrics computed in such a way that provide meaningful exception trades, but they also need to ensure that when such exceptions are discussed with the trader responsible the conversation makes sense to both parties.
- Regulatory and client reporting teams require consistent cost metrics that allow portfolio costs to be computed and aggregated accurately. Such teams will have less interest in idiosyncratic asset class specifics.
In conclusion, it is clear that building a cross-asset class TCA product is more complicated than perhaps you’d first think. The devil really is in the detail and it would already be a very large can of worms without all of the issues caused by inconsistent and missing data across the industry. Starting with a purist view to design a theoretically beautiful product is obviously a laudable initial objective, but this quickly starts to unravel when you have to get it working in the real world, dealing with many different users who have very different requirements whilst also trying to consolidate and normalise extremely messy data. This article explored some of the trickier areas where pragmatic solutions have been required to try to solve for some of the problems that have arisen during our development process. The ultimate objective is obviously to deliver a product solution, that caters to a diverse user base whilst providing the ability to measure costs consistently across FX, Fixed Income and Equities. We are on target to deliver on this objective by the end of the year.

Liquidity & Execution Style Trends
Great things are not accomplished by those who yield to trends and fads and popular opinion.
Jack Kerouac
In this short article we thought it would be interesting to highlight some trends that we are observing across the FX market with respect to liquidity and execution style. We particularly focus on a couple of the common themes, discussed ad nauseam on panels at the various industry conferences, namely:
- Fragmentation – is this really happening or not?
- Is the nature of liquidity changing?
- Algos – is their usage increasing or not?
- What are the most commonly traded algo types?
Fragmentation
We analysed the distinct number of ‘venues’ that have been tagged in trade data that BestX has analysed over the last couple of years. Given the lack of consistency in naming conventions it is difficult to provide a precise analysis e.g. some venues were tagged using codes that were either impossible to interpret or simply classified by the liquidity provider as ‘other’. In addition, it is rarely possible to distinguish between a ‘venue’ that is simply a liquidity provider’s principal risk stream, and those that are dark pools of client orders allowing true crossing. Finally, all price streams from one liquidity provider are grouped together as one venue.
It is for these reasons that we describe ‘venue’ loosely, i.e.
- an ECN
- a liquidity provider’s principal book (bank and non-bank)
- dark pools or internal matching venues (where identified)
Given these assumptions, the count of distinct venues that BestX has observed since January 2018 on a monthly basis are plotted below, increasing from 47 in January 2018 to a peak of 67 in July 2019. Such fragmentation is also cited in the recent published BIS quarterly review [1].
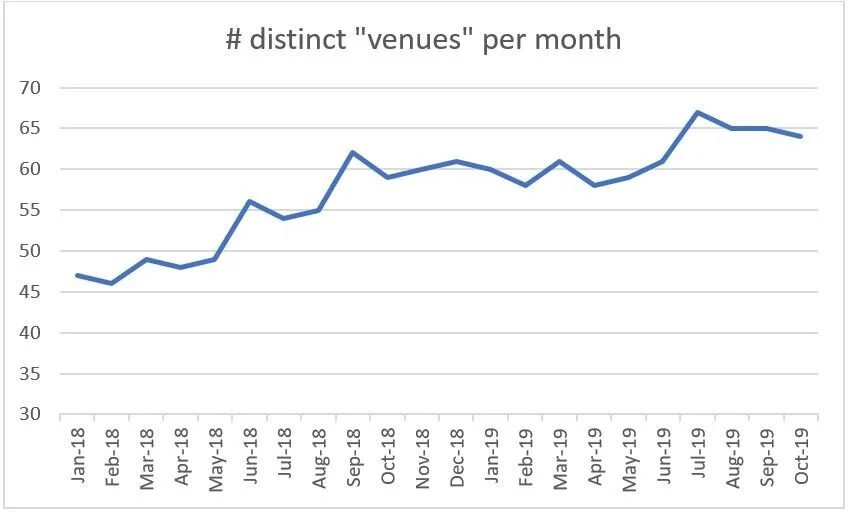
Please note, that the absolute numbers are probably underestimated given the assumptions mentioned above, and especially due to the number of indistinguishable codes grouped into the ‘Other’ category. However, the trend is clear and, although it is uncertain how much of the increase is due to truly new venues, there is no doubt that algos are increasingly accessing a wider set of liquidity pools.
Liquidity Type
Digging a little deeper, we then explored if the nature of the liquidity that was been accessed was changing. More ‘venues’ doesn’t necessarily mean more liquidity given the issue of recycling, or improved performance, given the possibility of increased signalling risk.
In terms of volumes traded, our dataset confirmed what is widely cited in the trade press, in that the share of volume traded on the primary FX venues is decreasing. The chart below shows the proportion of volume traded in Q1 18 compared to Q1 19, and the primary venue share has fallen from 11% to 8% over this period.

Interestingly, the ‘winners’ over this same period are clearly the bank liquidity pools, which in this dataset are a mixture of electronic market making books and client pools, but in both cases can be classified as ‘dark’. The increase over this period was from 43% to 61%.
The Use of Algos
So, it is clear that the variety of liquidity, and nature of the that liquidity, is changing. We now turn our attention to execution styles, and in particular, focusing on whether the use of algos in FX is increasing or not. Indeed, Greenwich Associates reported recently that they had found FX algo usage had increased by 25% year on year [2]. FX algos have been around for a long time, with some market participants referring to the first algo execution way back in 2004. However, adoption has been slow, with anecdotal evidence indicating that algo volumes have only really started to pick up in the last couple of years.
Our research shows that the % of overall spot volume now traded algorithmically has increased significantly in recent years, as illustrated in the chart below, with algo market share increasing from 26% in 2017 to 39% in 2019 year to date.

There may be some bias in these numbers from an absolute perspective due to the nature of the BestX client base, which tend to be more sophisticated execution desks which are well-versed in the use of algos. The trend, however, is very clear and we have seen evidence of increased algo adoption across the industry, both in terms of increased use by seasoned algo users, and adoption by clients that are new to algos.
Over the last couple of years, we have seen over 170 different algos used by clients of BestX. The algo type or style that is currently seeing the largest market share is TWAP, with almost 18% of algo volume traded in this style. In terms of market share, the next 5 algos hare approximately 28% of the volume, as illustrated below:
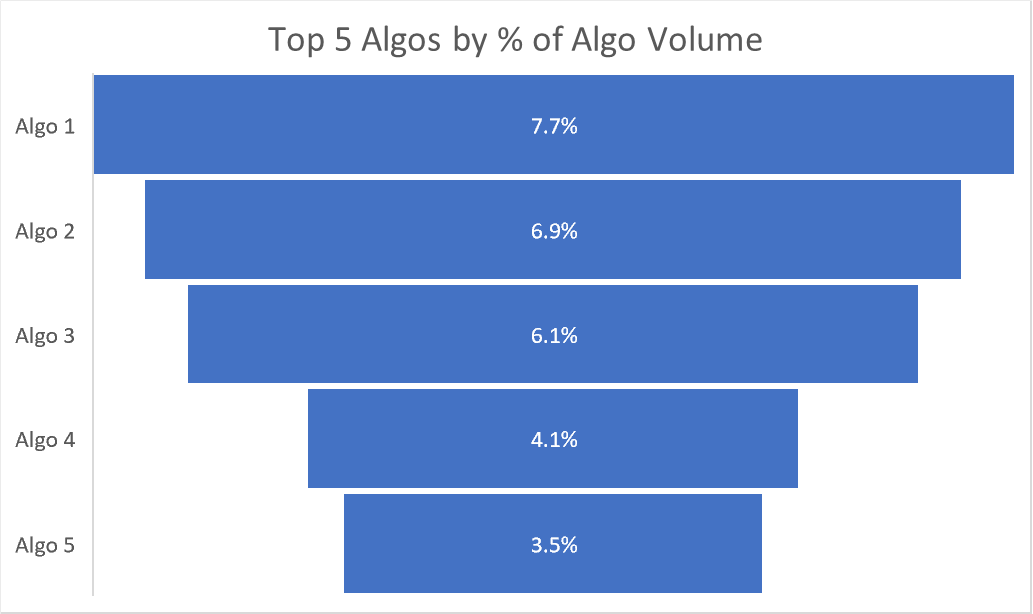
Looking at the volume traded per algo, if we exclude the TWAP category, the average market share is 0.5%, and the distribution of market share has a standard deviation of 1.1%. There is a long tail in the distribution, with the top 20 algos accounting for just under 60% of the volume.
Conclusions
Over recent years the FX market has clearly witnessed a proliferation in the numbers of liquidity ‘venues’ and the number of algorithmic products made available to end investors. Forecasting the future is clearly prone to error, but it feels instinctively that the proliferation is coming to a natural end, and, could possibly reverse given the ever decreasing margins. The issues with phantom and/or recycled liquidity are well known, which indicates that the future state may result in less venues, with the landscape comprised of a more distinct collection of unique liquidity pools. This naturally points to the continued significance of large, diversified pools that large market-making banks can support. The increased use of independent analytics and more transparency provides investors with greater comfort when executing in such ‘darker’ venues. Indeed, a number of voices across the industry are questioning the post MiFID II drive for OTC markets to follow an equity market structure path into multi-lateral lit central limit order books, and specifically asking the question whether this lends itself to achieving best execution for the end investor.
The same argument may also be applied to the algo product proliferation, especially given the general investor desire for simplicity, coupled with performance, a perfect example of ‘having your cake and eating it’. However, increasing regulatory obligations on the buy-side, for example the Senior Managers Regime in the UK, will probably reinforce the requirement for complete transparency on how an algo is operating, and the liquidity sources that it is interacting with.
A final conclusion from the study is how difficult it is to aggregate data within the FX market given the lack of standard nomenclature and definitions e.g. we see one of the primary venues described in 6 different ways within BestX. Establishing some standard market conventions, including naming conventions for venues, liquidity providers and standard definitions of time stamps across the trade lifecycles, would be extremely beneficial to the industry!

Signal and noise in the FX market
In our latest research article we explore a method for attempting to estimate how ‘informed’ the trading activity is in the FX market over a given period of time.
This method is based on the VPIN metric, or Volume Probability of Informed Trading, which has been applied in other asset classes. Using VPIN in OTC markets such as FX is more challenging due to the lack of absolute volume numbers, and moreover, within FX the diverse set of trading objectives (e.g. hedging, funding, retail etc) which add additional noise.
However, in this paper we explore a method for computing this metric using an approximation of volume and discuss potential applications. The initial results do appear intuitive, for example, we observe an increasing proportion of ‘informed’ trading leading up to the 4pm WMR Fix. Our research into this field will continue as we think there are potential applications in enhancing our Pre-Trade module further e.g. in selecting an execution protocol or algo, or determining how long to run an algo for, or how passive to be etc.
Please email contact@bestx.co.uk if you are a BestX client and would like to receive a copy of the paper.

Measuring the Unmeasurable?
“Somebody said it couldn't be done”
Edgar A. Guest
At a recent fixed income conference, the title of the obligatory TCA session was ‘measuring the unmeasurable’. There are many in the industry that still hold this view, and that traditional TCA is either not relevant or impossible to measure within Fixed Income. However, at BestX, we would prefer to think along the lines of ‘some of it isn’t measurable, but for a large proportion of the Fixed Income market, it is possible to generate some meaningful analysis that can add value’. Admittedly, not as snappy a title for a conference session, but a fair reflection of the reality of the current status. In this article we draw on our own experiences of expanding our BestX product across Fixed Income to highlight some of the issues and how we’ve tried to address them.
There are many hurdles to leap when attempting to build viable analytics to measure TCA for Fixed Income markets. To begin with, it is worth clarifying that in our view, TCA is a somewhat misleading term. We see measuring transaction costs, in the traditional TCA sense, as an essential component of an overall suite of best execution analytics, that seek to add value across the lifecycle of the trade and best execution process. But only a component.
Let’s return to first principles and recap on what best execution actually is. Not in terms of the formal regulatory text definition but in practical terms, what does it really mean? We distil the essence of best execution into the following 6 bullet points:
1. Best execution is a process
2. Covers lifecycle of a trade, from order inception, through execution to settlement
3. Requires a documented best execution policy, covering both qualitative and quantitative elements
4. Process needs to measure and monitor the execution factors relevant to a firm’s business
5. Any outlier trades to the policy need to be identified, understood and approved
6. Requires continual performance assessment, learning and process enhancement, i.e. a best ex feedback loop
Ok, so if we agree this is what we are trying to achieve in order to deliver upon our fiduciary responsibility to asset owners and our desire to optimise performance, it is clear that a simple pdf or Excel report with a single cost number, measured versus a single closing price of the day, is not going to be sufficient. Clearly a technology solution is required, that can be configured to an institution’s specific business, trading protocols and best execution policy. This solution needs to measure the relevant performance factors, automate the outlier monitoring process and provide flexible, interactive reporting analytics to dive into performance results to seek areas where additional value can be extracted.
Data Issues
Within such a solution, as accurate a measurement of cost as possible is obviously extremely important, and this was the first challenge we sought to tackle in our expansion to Fixed Income. For non-Fixed Income people, it may not be obvious why this is such a challenge so for fear of stating the obvious, it is all about market data availability. The issues here are numerous, for example:
- Coverage
- Timeliness
- Cost
- Quality
Now, we were hoping, as were many others, that the sunlit uplands post-MiFID II were going to be filled with overflowing volumes of cheap, if not free, market data that all market participants could readily delve into. This has not transpired. However, there are sources of quality, timely data available, at a price, and this is where we turned. We didn’t want to build a Fixed Income product that wasn’t commensurate with the quality of our award-winning FX product, so high quality market data was essential. However, given the sheer breadth and complexity of the Fixed Income market, where there are millions of securities traded around the world, there are always going to be gaps. Such gaps may be short term due to, for example, new issues, or more structural, for example, complex structured sections of the market just don’t trade in the conventional sense. This required thought when building the trade parsers and analytics engine to mitigate gaps in market data coverage and quality, a challenge made easier given the modern cloud-based technology stack we are working within at BestX.
With the best market data available, and applying innovation to the analytics, there is still the need for a healthy dose of pragmatism when measuring transaction costs in Fixed Income. Indeed, a client recently told us that in Fixed Income “a price is not a price, it is simply an opinion”! There are always going to be highly illiquid sections of the market that do fall within the unmeasurable category, but we have found that it is possible to construct accurate measures of mid for the vast majority of bonds. This then, obviously, allows decent spread cost numbers to be measured for a given time stamp(s).
Time stamps. Another data issue altogether, although one we are familiar with from FX land. Fixed Income execution is becoming increasingly electronic and automated, a required development as buy-side execution desks are increasingly asked to do ‘more with less’, with traders having to execute more tickets, become responsible for more products and develop experience in more execution protocols. From the analysis we have done so far, time stamping for trades executed over the various MTFs all look pretty robust, as you would expect. Issues tend to arise in voice executed business, although here the quality of time stamps is improving post MiFID II. It goes without saying but we will say it again anyway, it is impossible to measure anything accurately without a decent time stamp.
Issues around data accuracy: trade data, time stamps, market data and benchmarks appear to be the number one priority for clients when research surveys are conducted. Getting all this as right as possible is deemed much more important than, for example, automated connectivity with EMS/OMS platforms, at least for now. We obviously expect this demand to rise going forward once the basics are in place.
Making it actionable
Another of the common complaints around applying TCA in markets such as Fixed Income is ‘what do we do with the output?’. Measuring a simple cost number on an infrequent basis doesn’t lend itself to making any such analysis actionable. This is why it is key to implement any TCA metrics as part of a best execution workflow and lifecycle.
Back in October 2016[1] we talked about feedback loops in the best execution process and applying the concept of marginal gains to improve performance. There are many decision points in the execution process where additional data-driven evidence can help the trader make a more informed decision, for example:
- What time of day should I trade?
- What size of trade should I execute?
- Who should I execute with?
- Should I trade principal or request the counterparty to act as agent for my order?
- If I trade principal, should I trade via the phone or electronically?
- If I trade electronically, which platform should I trade on?
- Should I hit a streaming firm electronic price, or should I trade RFQ?
- If I RFQ how many quotes should I request?
- How quickly should I trade?
To ensure any output from your Fixed Income analytics can be actioned it is essential to have the following components to your TCA/best ex platform:
1. Intuitive, graphical interface which allows large data sets to be queried and filtered quickly
2. Enough data to make the performance results significant
3. Timely information and analysis
4. Ability to get into detailed diagnostics on a trade by trade level if required
We were already aware how important the last point was whilst building out our FX product. However, Fixed Income, with its more complex analytics, has increased this requirement even further. For example, it is imperative to be able to understand where a specific cost number is coming from, down to an understanding of which benchmark bonds were used to construct the yield curve if there weren’t sufficiently non-stale prices available in the specific security.
Conclusion
So, is Fixed Income TCA measurable? For a large part of this diverse and complex market, we think it is. Is it perfect? No, but our philosophy has always been to be pragmatic, rigorous and thoughtful when building what is possible under the given constraints. Getting such a first iteration out and used by clients allows us to evolve and improve over time, whilst at the same time hopefully benefitting from improved availability, quality and coverage of market data. For example, who knows, but a Fixed Income Tape, as mandated by MiFID II, may even appear one day.
To quote Edgar A. Guest’s tremendous poem again,
Somebody scoffed, "Oh, you'll never do that
At least no one ever has done it."
But he took off his coat, and he took off his hat,
And the first thing we know, he'd begun it.
With a lift of his chin and a bit of a grin,
Without any doubting or "quit-it".
He started to sing as he tackled the thing
That couldn't done. And he did it.
Ok, in true BestX style, there hasn’t been a lot of grinning, and certainly no singing, but we have done it.

Volume Prediction in the FX Market – learning from Earthquakes and Tremors
Prediction is very difficult, especially if it's about the future
Niels Bohr
In the context of achieving best execution, there is a growing focus on the pre-trade stage of the process. Accessing the most appropriate information at the point of trade can help execution desks make informed decisions around their various execution choices, including timing and style of execution.
When making an informed decision at the point of trade, one key input is an understanding of the prevailing liquidity conditions, and if not trading via risk transfer, an indication of how those conditions will develop during the period that the order is worked in the market. This is not as straightforward as it sounds, even for a listed market where liquidity data is readily available. For a market such as FX, which has a complex, hybrid market structure, with liquidity fragmented over many venues, it is extremely difficult.
Hence the need to look for help outside of traditional financial theories and practices. At BestX we are always creatively looking to solve problems by thinking laterally and learning from other disciplines and industries.
We are aware that the statistical properties of trading activity in FX exhibit clustering behaviour, similar to volatility, in that periods of high trading activity are more likely to be followed by another period of high trading activity. This ‘memory’ effect is evident, for example, around key points in a trading day such as the release of key economic data, times of key benchmarks such as WMR etc. This behaviour led us to exploring a statistical framework that was first used to model the impact of earthquakes in terms of predicting the frequency and magnitude of subsequent tremors. This is analogous to the observed characteristics of trading activity and volumes, i.e. there is a ‘shock’, for example an unexpected interest rate rise from a central bank, which results in a significant spike in trading volume, which then proceeds to have ripple effects throughout the market over an ensuring period of time. Clearly, there would be significant value if it would be possible to have some form of estimate of how the ensuing liquidity conditions would evolve, both in terms of magnitude and frequency.
Before we explore such a framework further, lets just return to why this should be of any use whatsoever? Well, for example, if you are looking to execute a large block of risk, say 1bn USDJPY, and have discretion on the execution approach and timing, then having some idea of how volumes in USDJPY may evolve over the next hour could be a key input in your decision making. If you’re objective is to minimise spread cost, and you are therefore leaning towards selecting an algo designed to be passive in the market and ‘earn’ spread, key variable for the performance of such an algo will be the depth of liquidity available to the algo whilst it is working. If, from previous experience, you know that the algo you are planning to use performs particularly well in market states characterised by high volumes, then a prediction of volumes will help decide whether to press ahead with this strategy or perhaps select a different product. Or, you may be seeking to minimise market impact and wish to time the trade to coincide with a high volume period to help ‘hide’ the trade. Insights into when such periods may occur over the next few hours is clearly helpful in this decision making.
Back to earthquakes. A statistical framework called the Hawkes Process has been used for some time for modelling earthquakes. This framework relies on historical information but is ‘self exciting’, which is the technical term for describing the phenomena where when an event occurs, e.g. an earthquake, then the probability of more events occurring, i.e. tremors, increases. From a volume prediction perspective, this can be thought of as a spike in trading activity due to a data release, will generally increase in increased subsequent trading activity. Over time, assuming there aren’t any further events, then the trading activity will revert back to its normal state. The Hawkes Process attempts to capture this behaviour.
As a brief aside, just to further clarify a key point – we are not attempting to predict an actual earthquake, or market shock. We are trying to predict what the likely impact of such an event will be. We were once asked if BestX had a model for predicting ‘flash crashes’, the query was met with an incredulous pause. If we had a model for predicting flash crashes then it is highly likely that the BestX business model would be very different, and probably involve relocating to the Cayman Islands and making lots of money.
Going back to Hawkes. Importantly, the hierarchical nature of the framework allows for the capture of the effect of different volume distributions typically observed on different days of the week. Also, the amount of trading also varies, with the quietest day of the week usually seen on Mondays, and Wednesdays showing, on average, the largest volumes. The charts below display the average intraday volume profiles for USDCAD over the course of 2016, also highlighting how different the pattern is on days such Non-Farm Payroll days, where trading activity is concentrated around the time of the data release.

So, does it work? Well, still early days but the initial results look very encouraging. The charts below show the predicted volume profile compared to the actual profile (black line), and the shaded area represents the 95 percentile confidence interval for this prediction.

We are now going to put the research into a development environment which will allow a more systematic testing of the framework, across many more currency pairs and using a much deeper data set to ‘train’ the framework. In addition, we wish to model other key event days such as ECB, FOMC meetings days, and also month, quarter and year-ends. Assuming the framework continues to perform to our satisfaction, we will then look to incorporate this within the BestX Pre-Trade module at a later date.

What are the factors that drive the cost of forward FX?
“Big Data is like teenage sex: everyone talks about it, nobody really knows how to do it, everyone thinks everyone else is doing it, so everyone claims they are doing it.”
Dan Ariely
As part of our ongoing quest to enhance our analytics, and to continue to meet our clients requests, we have been spending considerable time over the last few months researching ideas to model the expected cost arising from the forward point component of FX transactions. Such a model would complement our existing framework for estimating expected costs for the spot component.
This research is far from straightforward. The FX Forward market is still a largely voice driven market, often with significant biases in pricing arising from supply and demand or basis factors. This results in a general lack of high quality data with which to perform rigorous modelling. At BestX, however, we do now have a unique data set of traded data that allows for such research and we hope this will provide the foundation for the production of such a model.
We have decided upon a 2 phased approach. Phase 1 will be a relatively simple, yet pragmatic, extension of our existing parametric model for expected spot costs. We plan to launch this in Q1 to meet the initial need for a fair value reference point for the costs arising from forward points. Phase 2 is a longer term project, which will take us down the road of a data-driven approach as there are indications that a parametric model will have limitations when attempting to model the foibles of the forward FX market. We are already planning for this and have started research into using machine learning methods, including nearest neighbour algorithms, to cope with the complexity of this market. As part of this research, one of the initial pieces of work was to try to understand what the key drivers for FX forward costs actually are as we are aware of the risks of utilising machine learning on big data sets without an understanding of the fundamentals. We have summarised the initial findings of this work here.